Thomas Baker of Fobbing and the Peasants’ Revolt

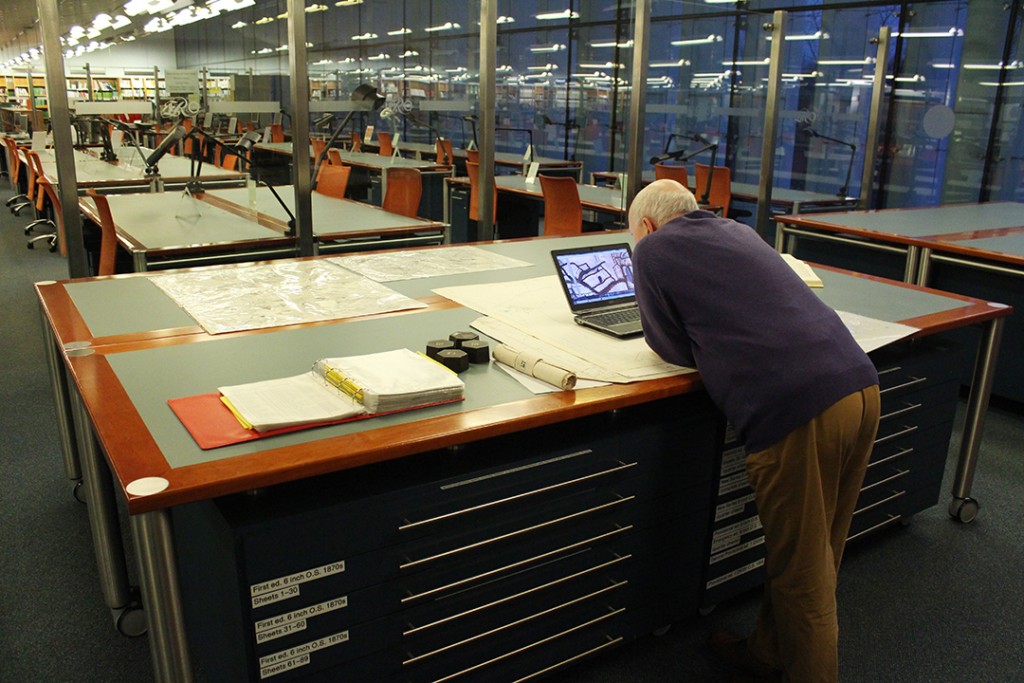
The Essex Record Office recently hosted the launch for the database of ‘The People of 1381’ (an Arts and Humanities Research Council funded project). As part of the launch
Katharine Schofield and Diane Taylor curated a surprise pop-up exhibition of relevant sources kept at the ERO.
In this blog Dr Herbert Eiden (Research Assistant for ‘The People of 1381’ project) reflects on why one of these documents holds particular interest.

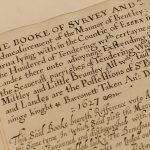
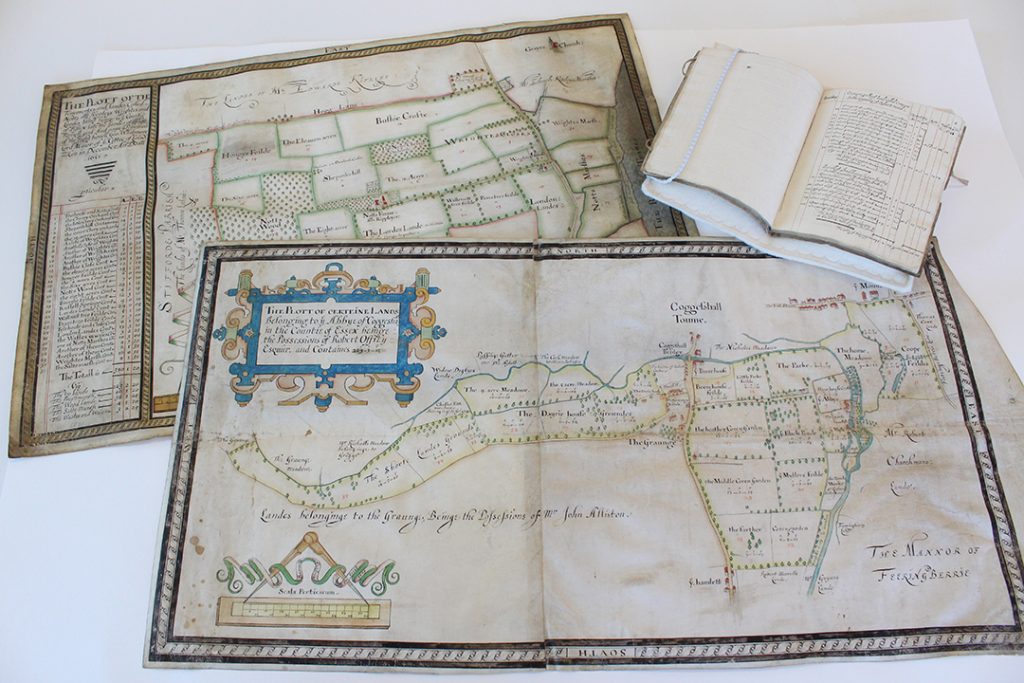
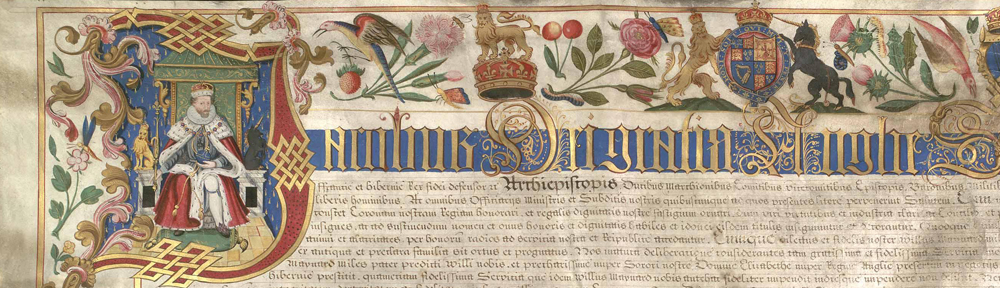
Amongst the documents on display at the launch event– mainly manorial court rolls – was this rather inconspicuous property deed dating from four years before the revolt.

Grant of lands in Basildon, Laindon, Ramsden Crays, Nevendon and Fobbing, 25 October 1377 (D/DHf T41/56)

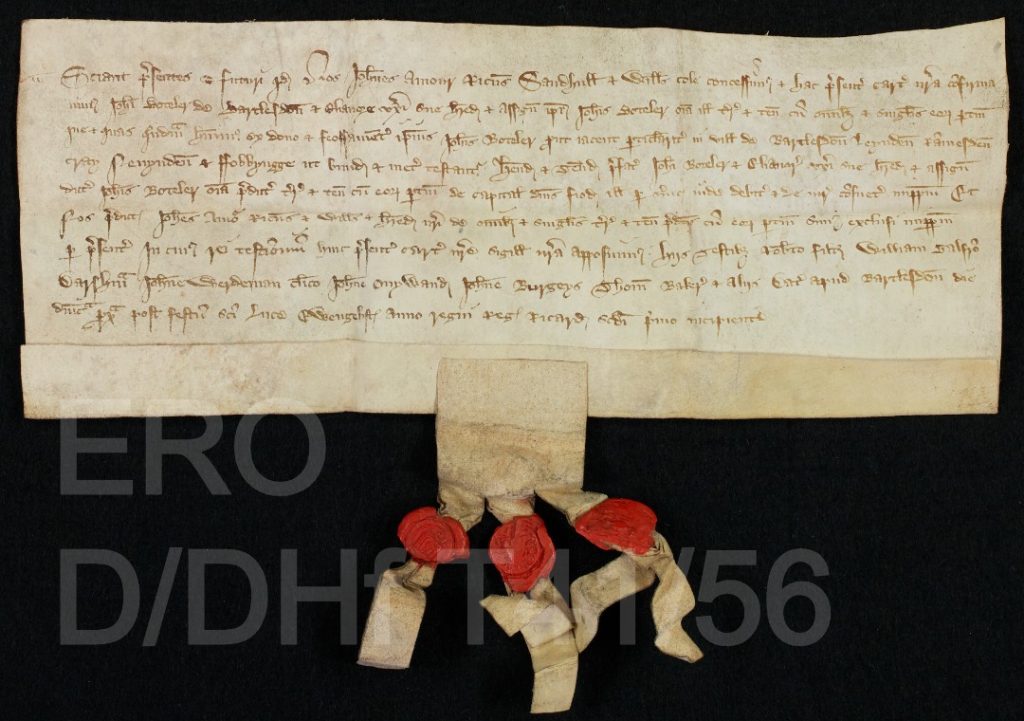
In the list of witnesses in the otherwise unremarkable grant of lands and tenements in Laindon, Ramsden Crays, Nevendon and Fobbing is one Thomas Baker. This is very likely the Thomas Baker who was named by the contemporary chronicler Henry Knighton as the ‘first mover’ of the rebellion.

In several inquests after the rising Baker was accused of having been present at Brentwood on 30 May 1381, when a royal commission enquiring into non-payment of the third poll tax was put to rout. Afterwards he ordered messengers to proclaim the uprising in south-Essex and probably beyond the Thames in Kent.

He was also charged with taking part in the attack on Cressing Temple and Coggeshall. He was found guilty as charged and drawn and hanged in Chelmsford on 4 July 1381.

It is known from an escheator inquisition taken eight years after the rising that, at the time of his death, Thomas held of the abbot of Waltham Holy Cross a croft called ‘Bakerescroft’ containing 6 acres of land in Fobbing as well as a messuage with garden of Joan de Bohun, countess of Hereford, and lady of the manor of Fobbing.

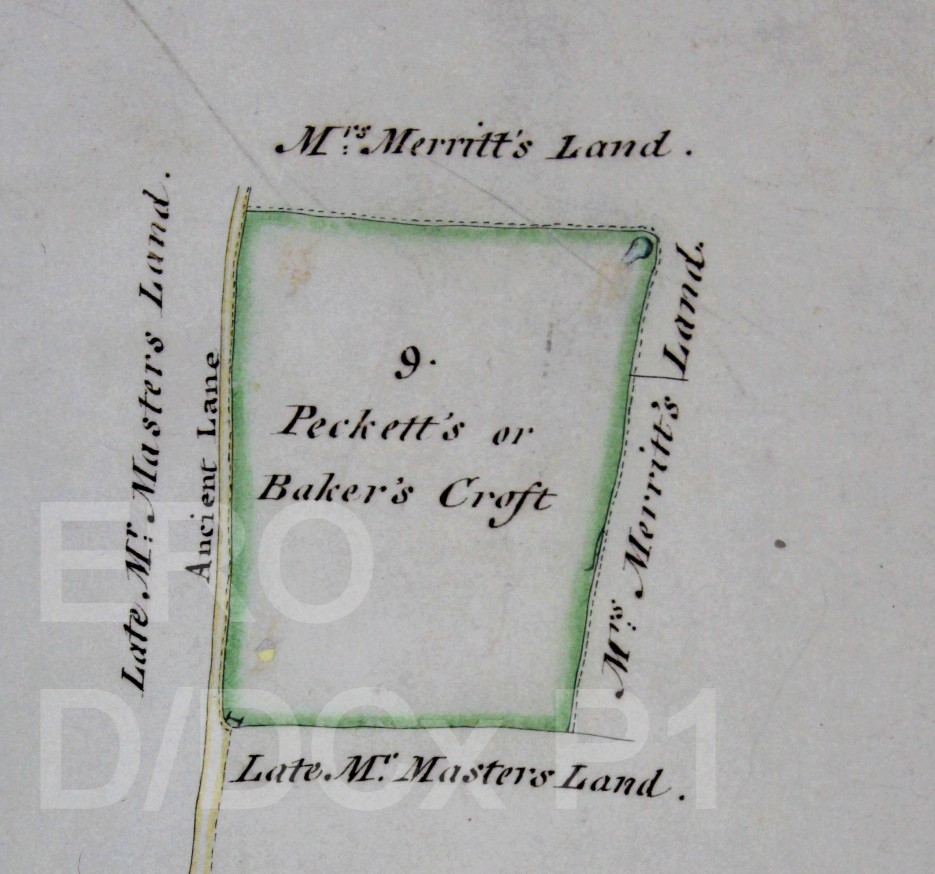
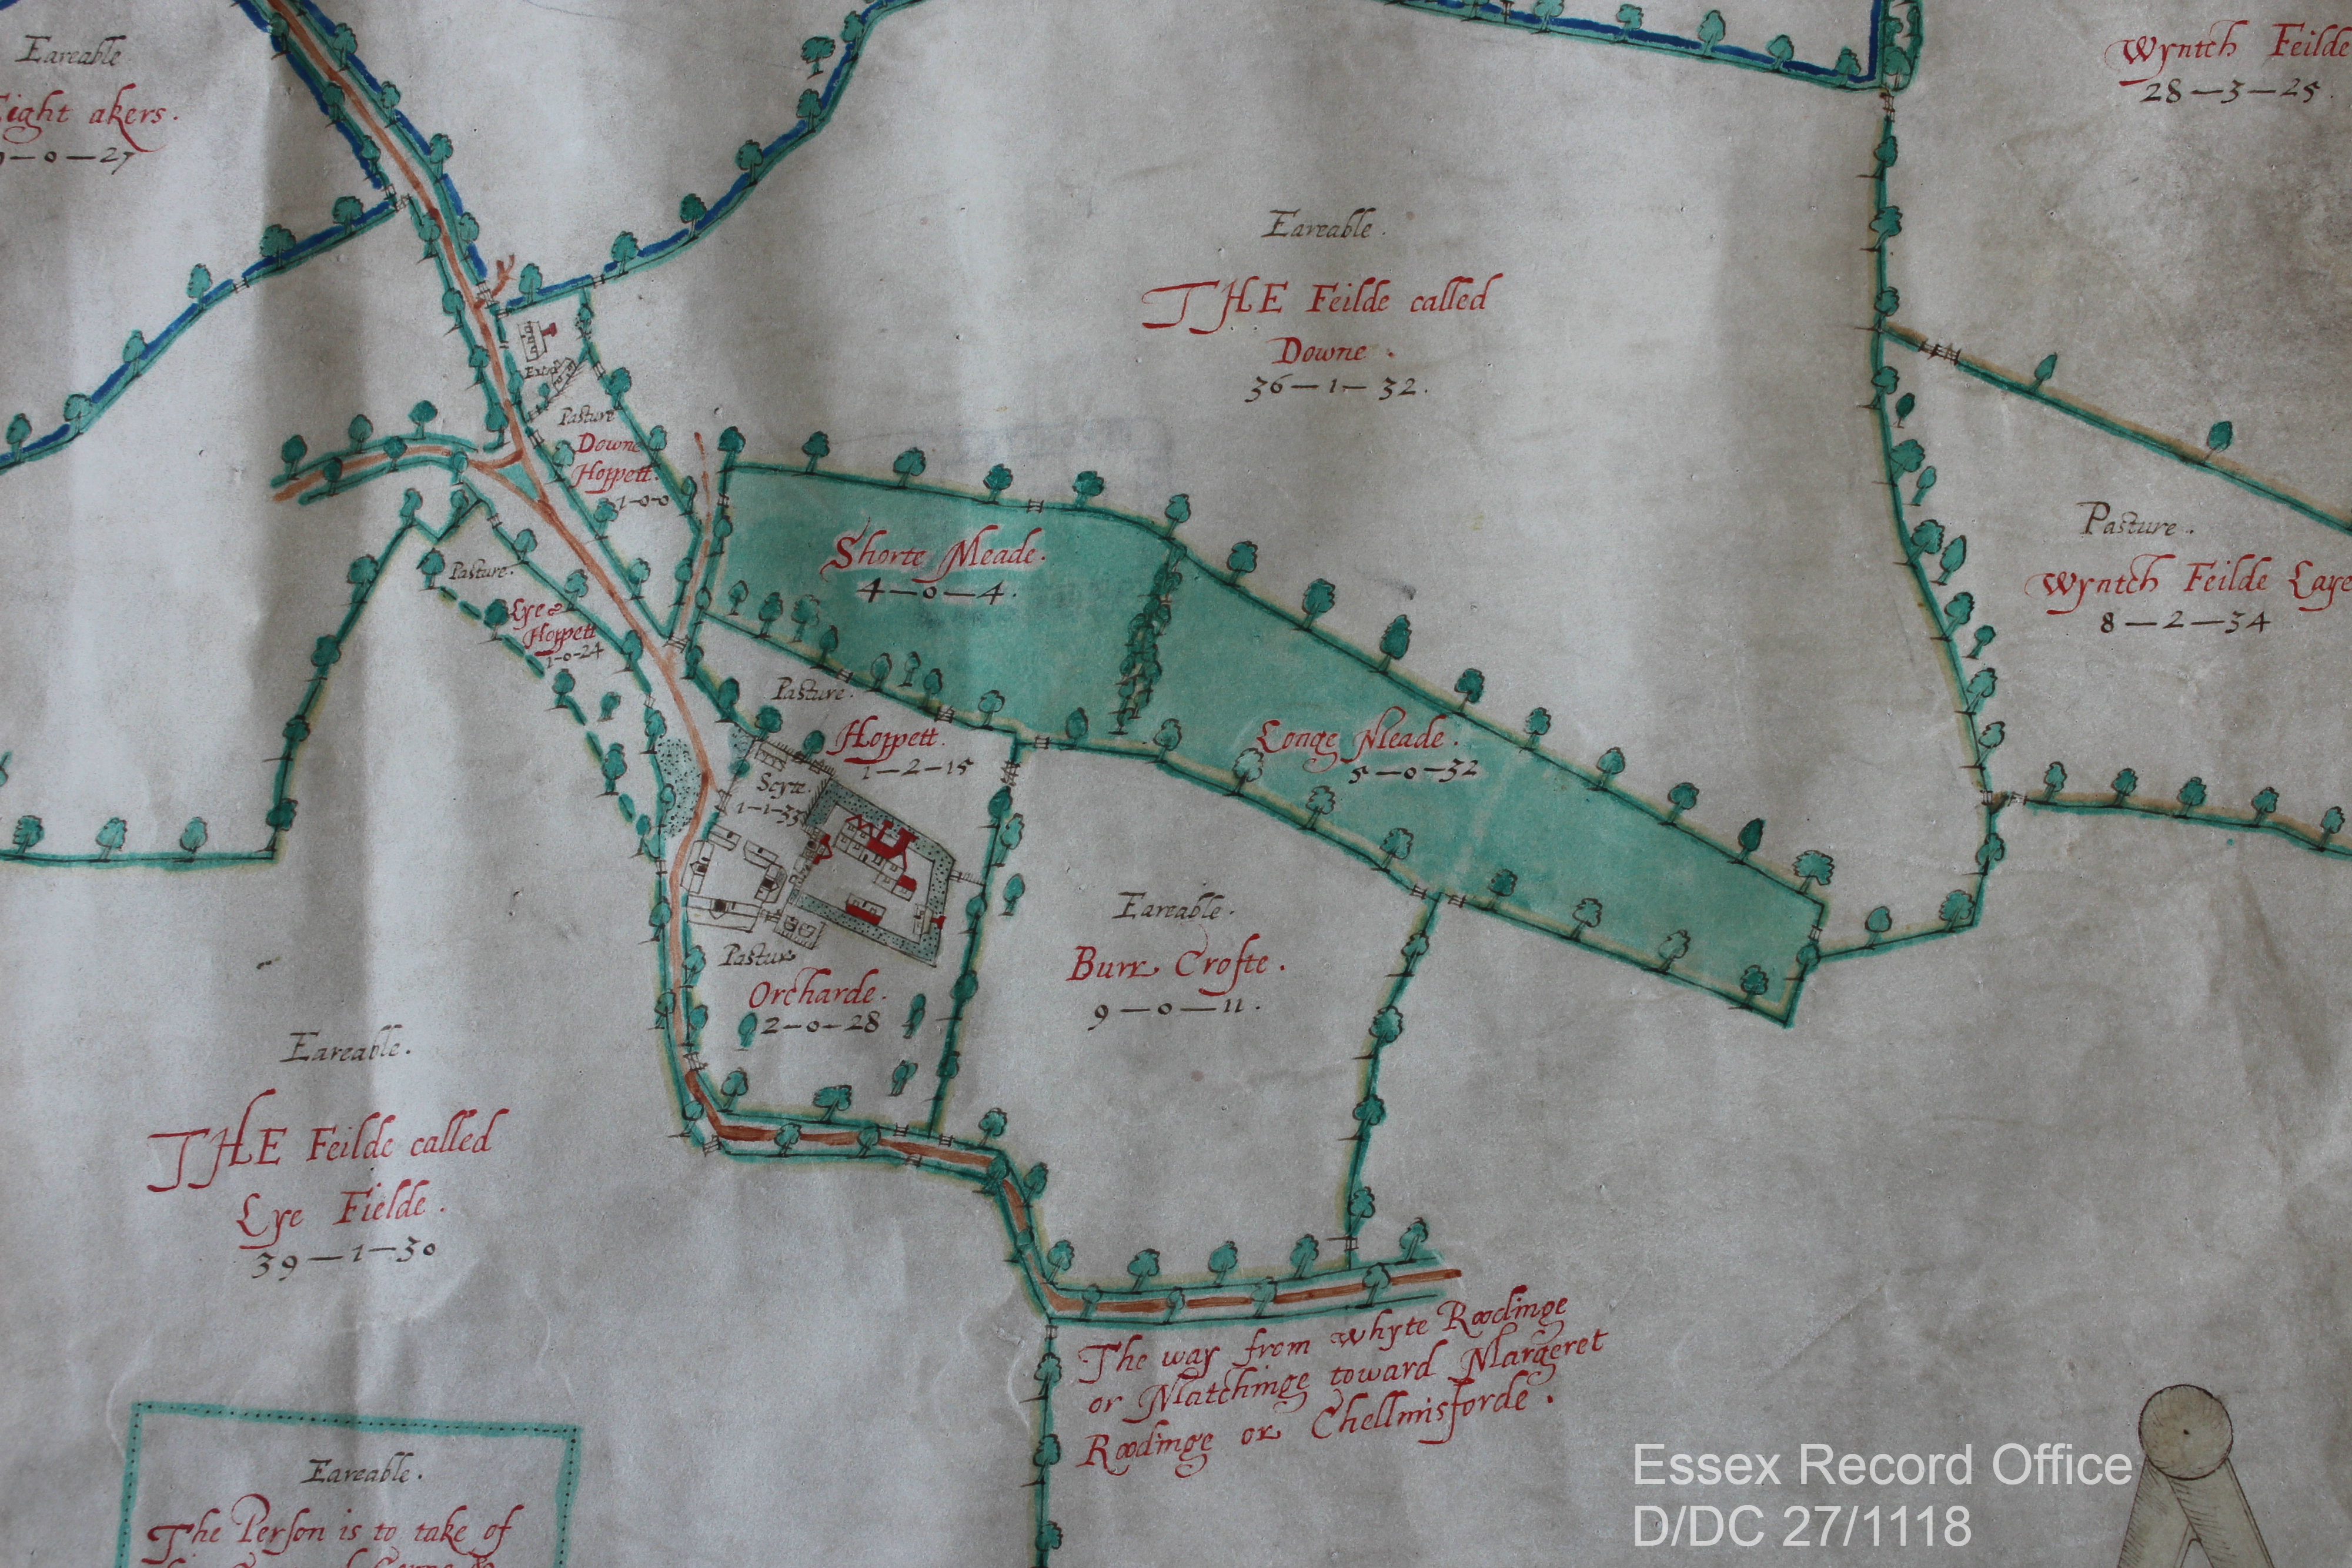
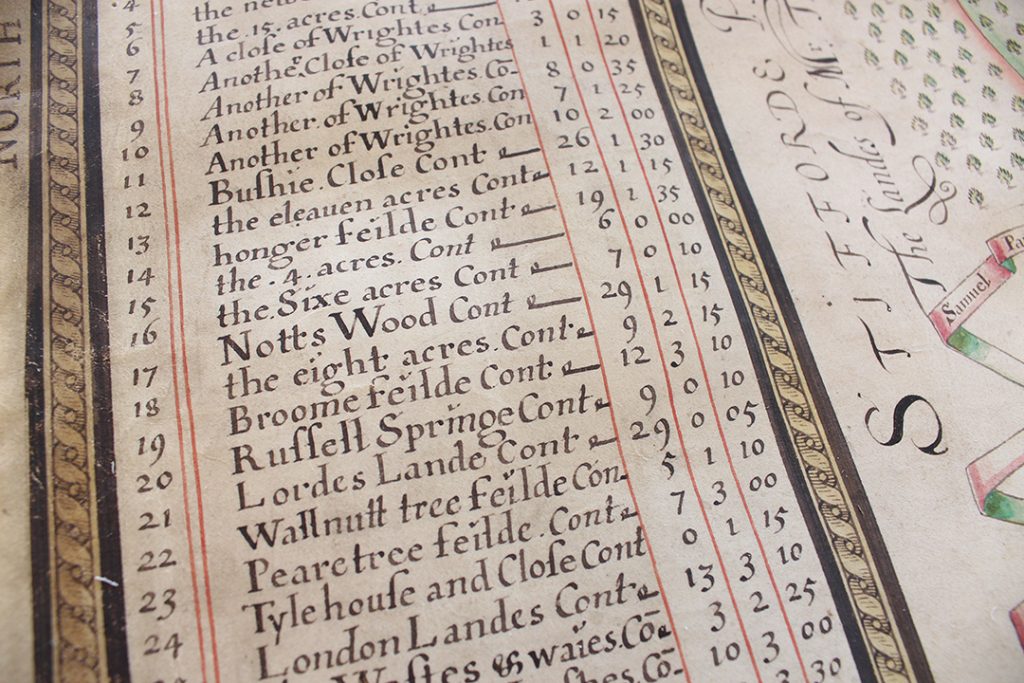
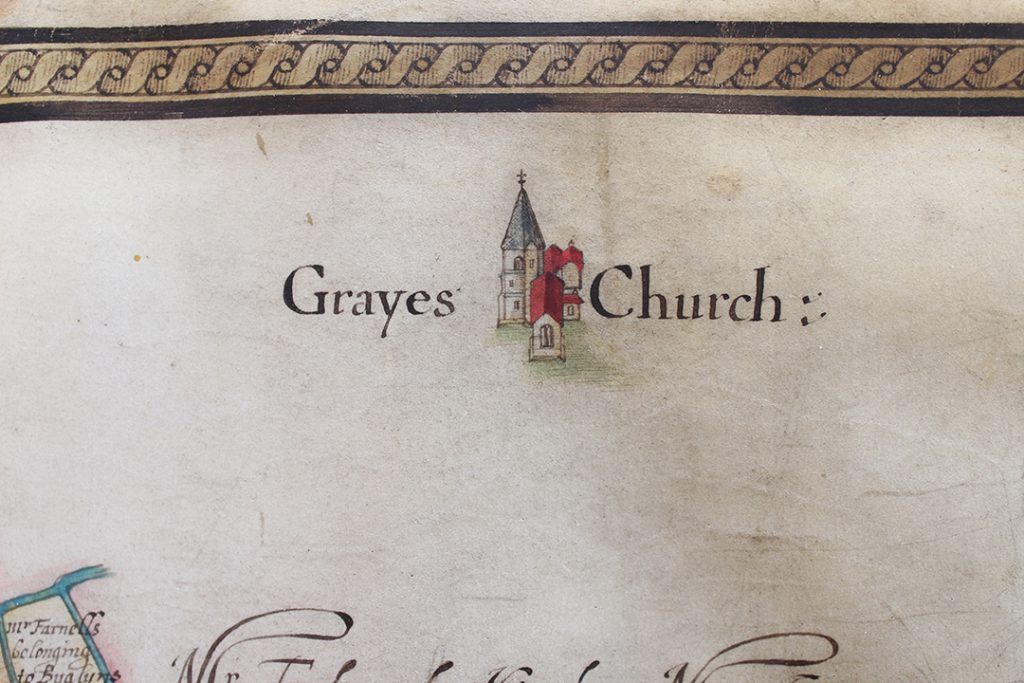
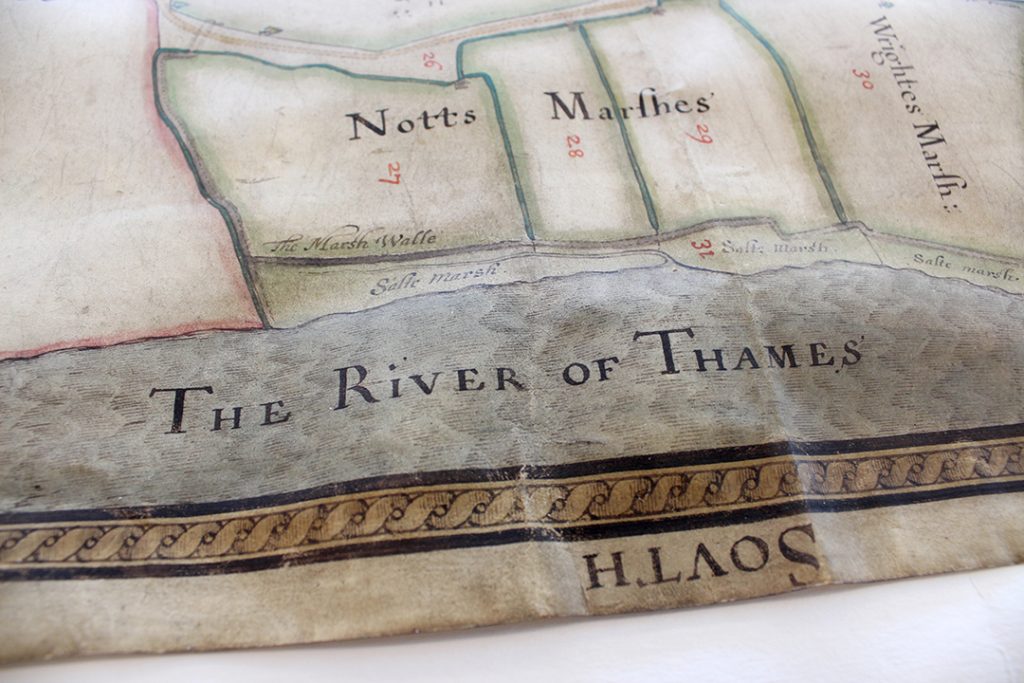
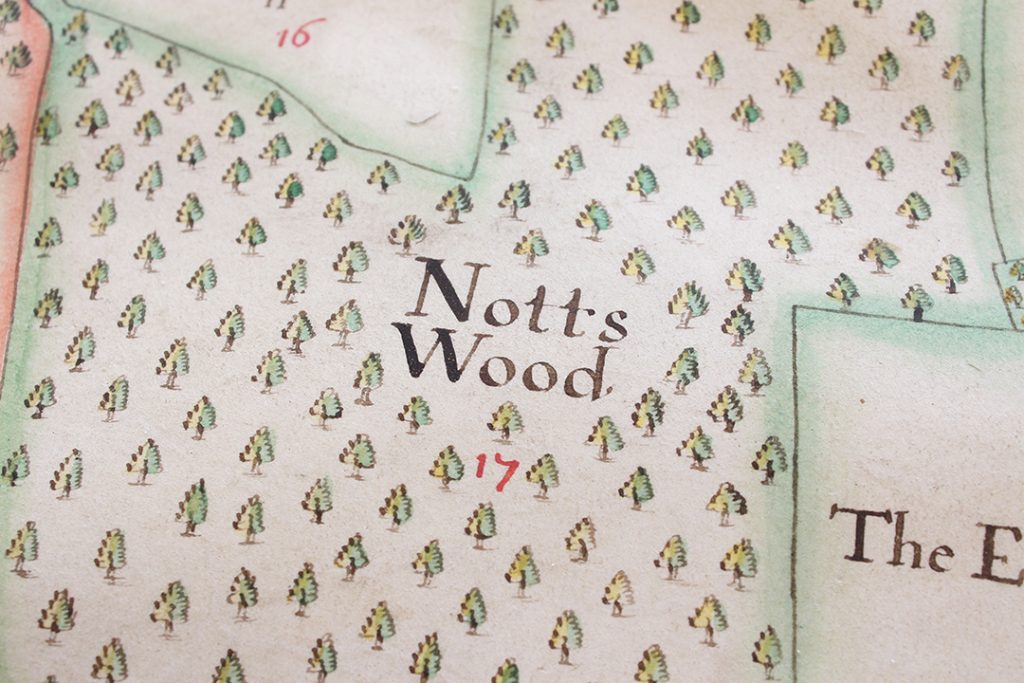
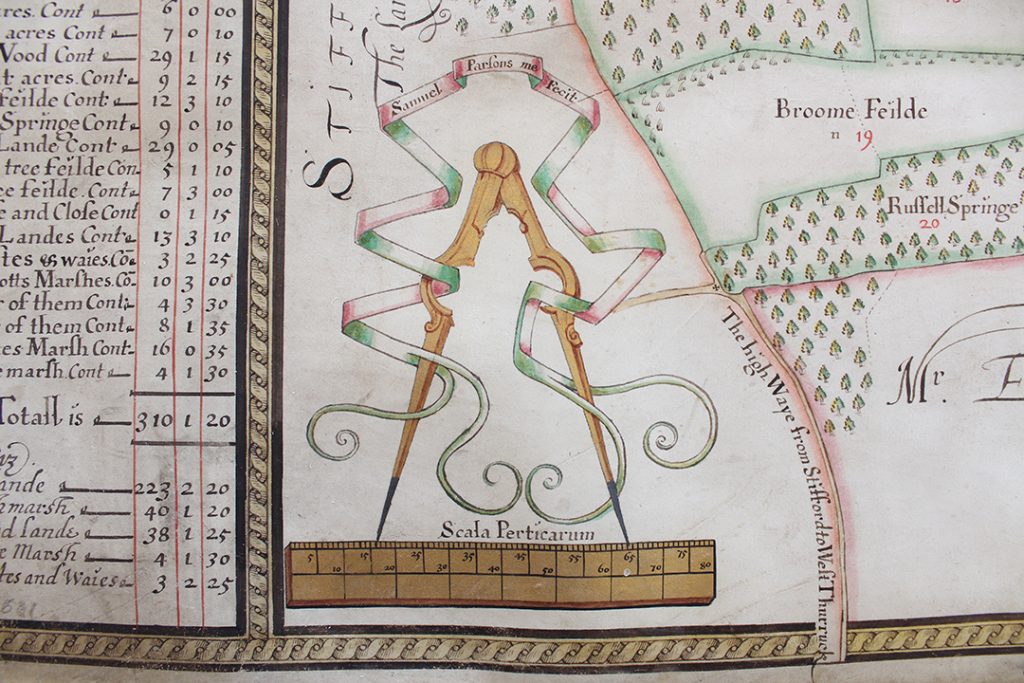
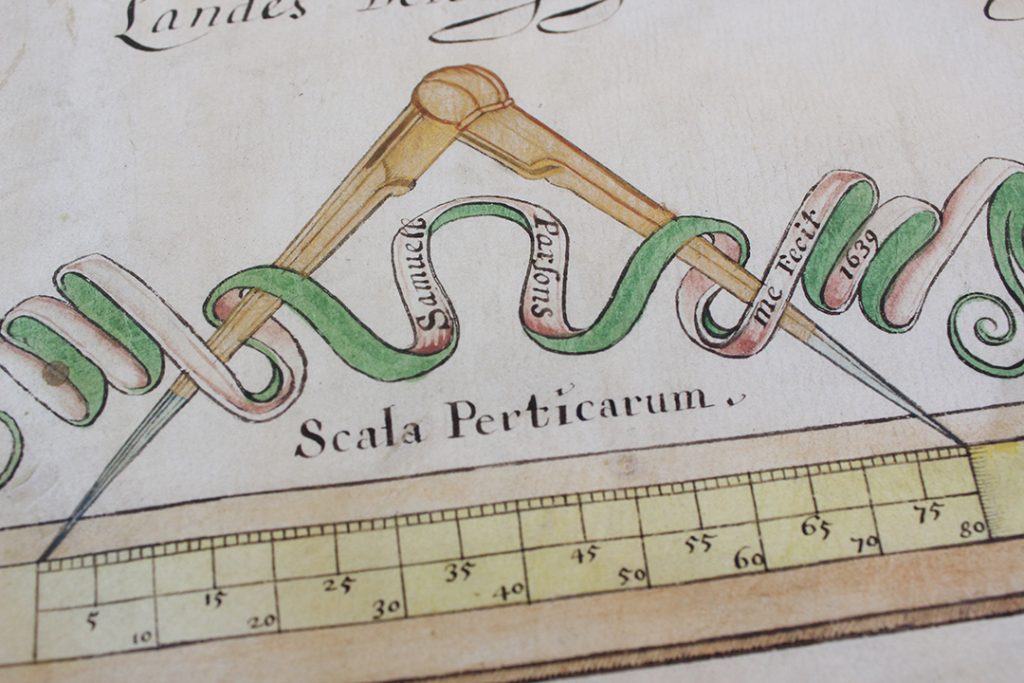
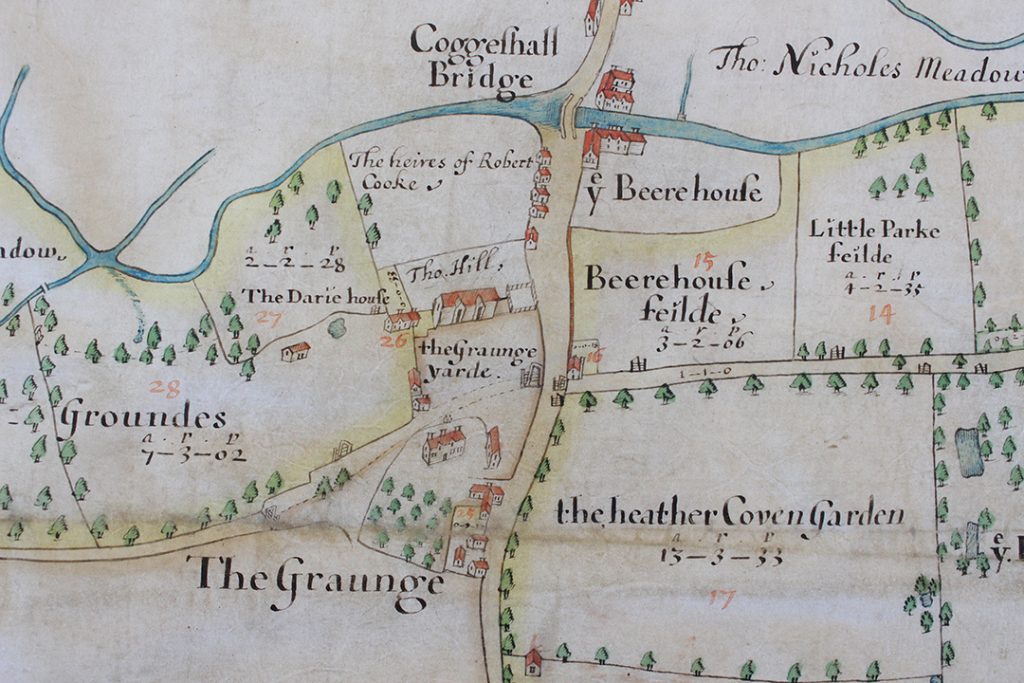
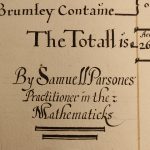
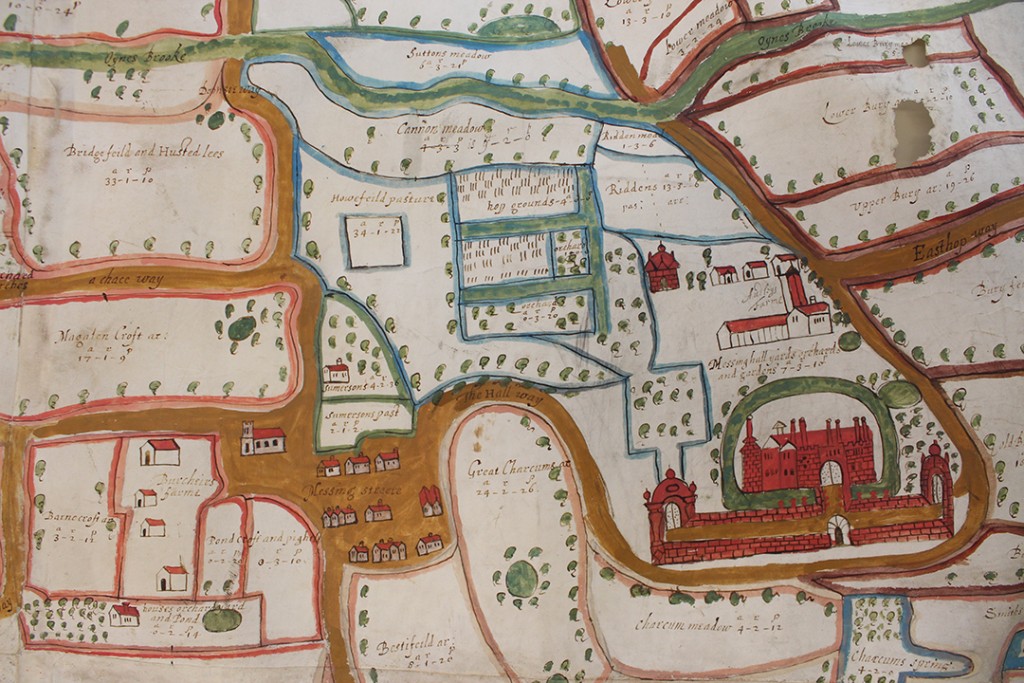
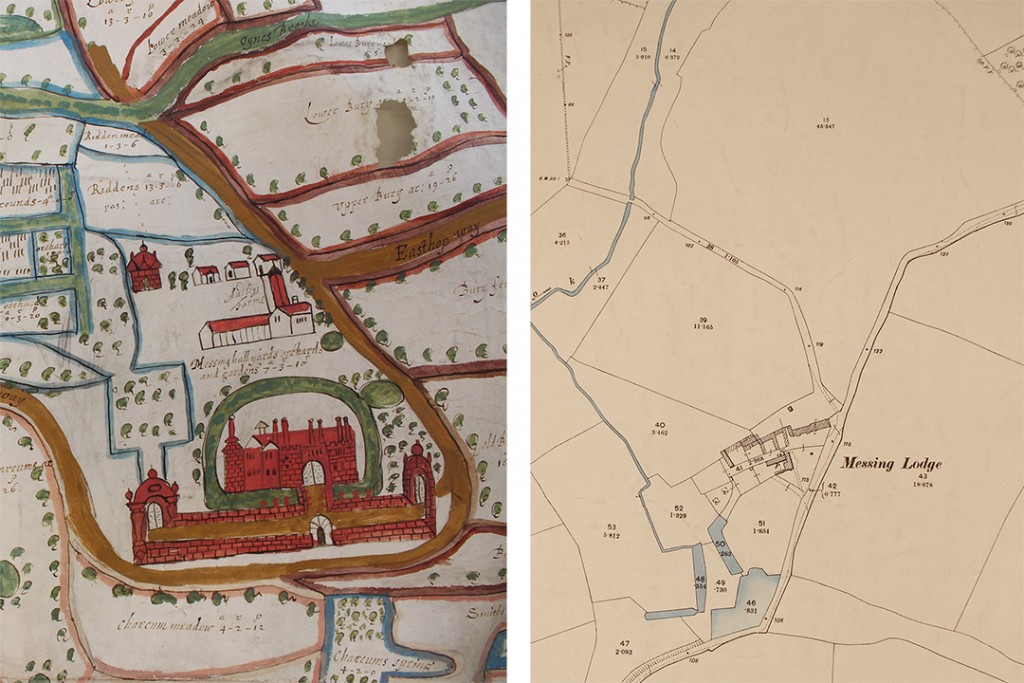
Map of estate of Thomas Drew in Fobbing and Corringham, 1781 (D/DCx P1)

This map, dated four hundred years after the Peasants’ Revolt, shows Bakers Croft in Fobbing: a smallholding of more than 6 acres of land. It has been identified as possibly being the land of the rebel Thomas Baker.

Yet, nothing is known about his life up to 1381.

The manorial documents of Fobbing in the second half of the 14th century are lost. This is where this snippet of information from the deed fits in nicely. Witnesses to medieval deeds were trustworthy local men of some standing. We can therefore infer that Thomas Baker was prominent in his area before he assumed a leading role in the repulsion of the tax commission.

A final twist is revealed by the presence of two other witness names. One, Geoffrey Darsham, or Dersham, who was the Earl of Oxford’s steward in south-east Essex, had his manor house of Barnhall in Downham destroyed and livestock stolen, and John Onywand, another of the deed’s witnesses, was a member of the jury presenting this allegation in 1381.

It is intriguing that three of the six people coming together in October 1377 to witness a land transaction found themselves on different sides of the divide only four years later: a rebel, a victim of the rebels, and a juror.

For more about the Peasants’ Revolt visit http://www.1381.online/

Changing land usage in Essex

Archive Assistant Neil Wiffen reflects on the changing pattern of land usage and the historic value of meadows to the Essex landscape.

There is currently much in the media about climate change and environmental degradation. We hear on almost a daily basis about the threat to different ecosystems and landscapes, as well as about worldwide species loss. We in the UK are not immune, and subjects such as the loss of meadows and the threat to bees are now quite common topics of discussion. Recently the BBC reported that, ‘over 97% of wildflower meadows have been lost since the 1930s, that’s a startling 7.5 million acres (3 million hectares). Species-rich grassland now only covers a mere 1% of the UK’s land area’ (http://www.bbc.co.uk/earth/story/20150702-why-meadows-are-worth-saving).

What have bees and meadows got to do with the Essex Record Office (ERO), we hear you ask? Well, working among our wonderful archives we are used to seeing lost landscapes of the past as depicted in maps or described in documents – a land before industrial agriculture and large-scale urbanisation.

One important, almost universal feature of any parish’s landscape would have been that ‘species-rich grassland’ mentioned by the BBC. They were generally described as meadows, which the ERO’s trusty copy of the Oxford English Dictionary (1933) defines as, ‘a piece of land covered with grass that is mown for use as hay. In later use often extended to include any piece of grass land’ (pasture, on the other hand, was used for general grazing of livestock). Look at any tithe, enclosure or estate map and there the meadows will be, often listed and somewhere along the way appraised as well.

Part of 1609 map of White Roding showing meadowland
Extract from John Walker junior’s 1609 ‘trewe and perfect’ plan of the ‘landes belonging to the Mannor of Mascalls Bury … within the parish of White Roodinge’ (D/DC 27/1118). It depicts the ‘Longe’ and ‘Shorte’ meadows adjacent to the moated house. Another important aspect of the farm and household economy, the orchard, can also be seen close by the house. Do note the spelling of arable as ‘Eareable’ – one can almost hear the Essex accent across the centuries!

— An image of the same location from Google Satellite, 2019.

The importance of meadows to people in the past was immense, particularly before the introduction of fodder crops, such as turnips, through the 17th and 18th centuries. Meadows were mown for hay in summer which was then used to feed overwintering livestock. Therefore the amount of hay harvested determined the number of cattle that could be kept over-winter. So a good hay crop was an essential product of the agricultural year, with the whole community coming together to ensure it was harvested and stored successfully.

The high regard that meadows were held in can be seen by how they were valued. When the Escheator compiled the Inquisition Post Mortem (TNA, C 134/74/19) on the death of Nicholas Dengayne in 1322/3, his manors of Colne Engaine and Prested Hall (Feering) were valued. The 240 acres of arable land in the former was valued at 4 pence per acre, while 140 acres in the latter was 3 pence per acre. By comparison the 6 acres of mowing meadow at Colne Engaine and 5 acres at Prested Hall were all valued at 2 shillings per acre –  the equivalent of 24 pence per acre, or six to eight times the value of the arable land.

Quite what types of grasses and flowers these ‘traditional’ meadows were made up of is unknown, but we have to assume in an age before widespread use of agricultural chemicals they were very species rich with lots of insects as well. Not all ‘grassland’ was equal to a well-established meadow. By the 1930s 302,803 acres of ‘permanent grass’ was recorded in Essex (The Land of Britain: the Report of The Land Utilisation Survey of Britain part 82 Essex, copy  in ERO Library, Box 95), of which 92,300 was for hay – possibly this was mainly ancient meadows. The remaining 210,503 acres might not have been of the highest quality but rather a result of the agricultural depressions of pre and post First World War. This would have been the case with the 38,977 acres of ‘rough grazing’ – not all grassland was equal!

A local meadow in glorious technicolour! Along with various grasses there is knapweed, scabious and lady’s bedstraw. The honeyed aroma of the latter is intoxicating on a sunny day!

Now, we are beginning to appreciate our meadows once more and recognise their value as habitats to vital wildlife. While there has been a great loss of meadows, more are being planted, for example by conservation charity Plantlife. Perhaps our maps and documents will guide where new meadows could be sown?

What can you find out about your local landscape history? Check our introduction to the main sources for starting a place history, then come and explore what we have in our Searchroom.

Surveying Stuart Essex

New accessions arrive at ERO in a steady stream, and sometimes a very special survivor from the past comes into our care.

One such item that recently came into us is this map of Grays dating from 1631, made by a surveyor named Samuel Parsons (A14738 box 1).

The map in our Conservation Studio after being cleaned. East is at the top of the map. The area shown is the west side of Grays. London Road, shown running along the south side of the map, is today’s A126, and Hogg Lane, shown running along the east side of the map, is today the A1012. The salt marshes shown along the banks of the Thames are today housing. Part of the area shown in the middle of the map is today Grays Chalk Quarry Nature Reserve, part of it is Badgers Dene housing estate,  part of it is Askews Farm Industrial Estate, and part of it is a NuStar oil and gas terminal.

The map was made for George Whitmore, Lord Mayor of London, and shows land that he owned in Grays called Notts (alias Ripleys), Wrightes and Lords Land. Whitmore was a merchant and member of the Worshipful Company of Haberdashers. During the Civil War, not long after this map was made for him, he supported the king and was imprisoned by the Parliamentarians.

The map was made for George Whitmore, Lord Mayor of the City of London

Traditionally, surveys of estates were written documents, and the practice of making maps to either supplement or replace a written survey only started to take off in the 1570s. This type of map served two purposes: firstly, they were useful tools for ensuring efficient and profitable use of land; and secondly, they were status symbols for land owners.

At the centre of the map is Notts Farm, alias ‘Rippleyes’, surrounded by cherry orchards.

The names and acreages of the individual fields are listed along the left-hand side of the map, including ‘the eleauen [eleven] acres’, ‘Wallnutt tree feilde’ and ‘Pearetree feilde’.

Grays church is shown in the top right corner of the map.

And ‘The River of Thames’ flows along the right hand side of the map, with salt marshes along its edge.

Parsons shows wooded areas using tiny, individually drawn trees. Each one is coloured in green and yellow, adding detail and dimension.

The map joins two other documents made by Samuel Parsons already looked after at ERO. One is a map of land around Coggeshall Grange made in 1639 (D/DOp P1 – view a digital image of it here), and the other is a written survey of land in Little Bentley (D/DQs 4).

The Coggeshall map shares several stylistic similarities with the newly arrived Grays one. Both share the same patterned border, and decorative scale giving Parsons’s name as the maker.

The scale on the Grays map, bearing Samuel Parsons’s name

The scale from Parsons’s 1639 map of Coggesall, again decorated with compasses showing his name

The Coggeshall map shows Coggeshall Grange, including the barn which is today a National Trust property, shown here in ‘the Graunge yarde’.


The first surviving work of Parsons’ in Essex is his survey of land in Little Bentley in Tendring (D/DQs 4), made for Sir Paul Bayning, who was from a family of wealthy London merchants. This written survey book refers to a map made by Parsons at the same time, but this sadly seems not to have survived. Parsons signed this survey as ‘Samuell Parsones Practitioner in the Mathematicks’.

Parsons also made maps and surveys in Middlesex, Berkshire, Shropshire and Yorkshire. His map of Dringhouses in York (1624-29) is the earliest surviving large-scale plan of any part of York and its neighbourhoods, and even shows the names of the local people who farmed the land. York archivist Victoria Hoyle says that Parsons’s map ‘is so accurate, it perfectly matches the 1853 Ordnance Survey map’. (You can read more about the Dringhouses map here.)

The three documents made by Samuel Parsons which are now all part of the collections at ERO

Most of Parsons’s surviving maps were made in Shropshire (you can view an image of his 1635 map of Rudge Heath on Shropshire Archives’ catalogue here). Indeed, there is a connection between some of Parsons’s Shropshire maps and his map of Grays; some of his Shropshire work was for the Whitmore family of Apley Hall, of which George Whitmore (the commissioner of the Grays map) was a member.

In his study of 17th century mapmakers in Essex ‘An upstart art. Early mapping in Essex’ (T/Z 438/2/1) A. Stuart Mason, an expert on early map making suggests that Parsons may have been based in London, meeting his wealthy clients there, and being despatched to the countryside to survey their estates. His signature as a ‘Practitioner in the Mathematicks’ could suggest, according to Mason, that Parsons may well have taught mathematics in London alongside his surveying work.

Parsons made maps of extraordinary quality for their time, and we are very happy to welcome this new addition into our collection.

Chelmsford Then and Now: layers of history

In the twelfth and final post from our Chelmsford Then and Now project, student researcher Ashleigh Hudson explains how during her research project we used maps to establish areas of continuity and change in the High Street of our county town.

A key objective of the Chelmsford Then and Now project was to establish what has changed and what has stayed the same over time in the centre of our county town. We are lucky that Chelmsford has been mapped and re-mapped several times over the centuries, enabling us to make comparisons over time, and to find traces of the medieval town in today’s High Street, even though no buildings from that period survive. In this post we will show how we have used maps in this project to look at the detailed history of specific properties.

The earliest known map of Chelmsford was drawn up by John Walker in 1591. The shape of Chelmsford High Street, as depicted on the Walker map, is remarkably similar to the shape of the high street today; in fact the basic make-up of the town has not changed in nearly five hundred years. Internally, the shape and size of individual properties has varied significantly over time, reflecting changing economic, demographic and technological trends. The 20th century in particular saw sweeping changes to areas of the high street. As the town’s population increased, the demand for more retail spaces grew, and the arrival of department stores facilitated the absorption of many of the smaller businesses.

southend saturday

Extract from John Walker’s map of Chelmsford, 1591.

Observing the sites of 61-66 High Street on several Ordnance Survey maps, it was immediately obvious that a number of properties had been consolidated, demolished or rebuilt over time. Using the first edition OS map of 1876 as a starting point, it is clear that large, department sized stores were not yet a standard feature of the high street. Based on this map, we can see that properties in this section of the high street were small and packed closely together, perhaps the result of centuries of uncoordinated and sporadic development.

(2) OS Map 1876

Extract from the 1876 first edition OS map, from the west side of the high street. 61 High Street is occupied by the Queen’s Head inn. Adjacent to the Queen’s Head sits a narrow passageway, which leads from the high street into the yard. To the north of the passageway is the site of 62 High Street and adjacent to that, a number of small, individual properties, all of which would ultimately form part of the Marks and Spencer’s site in the 1970s.

For a more direct comparison, we took photographs of the OS maps from 1963 and 1974 and uploaded them into Photoshop.

(3) 1963

Extract from the OS Maps of 1963 and 1974 showing the sites of 61-66 High Street. The 1963 extract has been highlighted in red, while the 1974 extract has been highlighted in blue.

(4) 1974

Extract from the OS Maps of 1963 and 1974 showing the sites of 61-66 High Street. The 1963 extract has been highlighted in red, while the 1974 extract has been highlighted in blue.

From there we layered the maps, drawing around the border of each property using different colours to make it easy to differentiate between them. Areas where the borders had shifted were then clearly visible, indicating where and when development had occurred.

(5) 1963 and 1974 layered

Extract from the 1963 map highlighted in red, layered with the extract from the 1974 map highlighted in blue.

At first glance, the OS map of 1963 appears remarkably similar to the OS map of 1876. There are still plenty of small properties, packed closely together. The Queen’s Head is still present, identifiable by the ‘PH’ for public house. The property retains its distinctive shape and the narrow passageway, sandwiched between 61 and 62, is still visible.

The biggest and most obvious changes have occurred by the OS map of 1974. The 1974 map presents a significantly changed section of the high street. The former Queen’s Head building has been demolished, and in its place a uniform, rectangular building has been erected. The narrow passageway has been built over and now features as part of the sites of 61 and 62. The sites of 62-66 now form one large property, occupied by Marks and Spencer’s.

(6) SCN 4595

Photograph of the west side of the high street including the Queen’s Head in the centre and several properties to the right that would eventually form part of the Marks and Spencer’s site. Photo by Fred Spalding.

(7) Current Image

A current image of the west side of the high street.

This map comparison perfectly illustrates how the town was transforming in the 20th century to accommodate modern development. In many cases the new buildings replaced small, dated properties which were considered no longer fit for purpose. The imperfect, quirky buildings visible in the Spalding photograph above were replaced by larger modern buildings built over several of the historic plots. Whether these new, spacious retail establishments improved the overall appearance of the high street is open to debate.

If you would like to use historic maps for a project of your own, do come and visit our Searchroom where staff will be happy to help you get started.

And that’s all from the Chelmsford Then and Now project! We will shortly be publishing the results of a similar project undertaken in Colchester so if you like old maps and historic photos there are more treasures to come.

Leigh-on-Sea on the Map

“a pretty little town, well stock’d with lusty seamen”

This vivid description of Leigh-on-Sea comes from William Camden’s Britannia, a survey of Great Britain and Ireland published in 1586.

We are diving in to Leigh’s history at the moment ahead of Leigh-on-Sea on the Map on Saturday 18 February 2017, when we will be displaying a selection of our historical maps and images of Leigh at The Forum in Southend, showing its transformation as development spread ever further out from the small old town area that hugs the Thames shoreline.

Here we share some sneak peaks at some of the maps and postcards we will be bringing with us to display.

Leigh tithe map, 1847 (D/CT 217B)

IMG_8898 1080 watermarked

Extract from the Leigh tithe map, 1847 (D/CT 217B)

The centrepiece of our display will be Leigh’s tithe map, which dates from 1847. The map shows Leigh just before the coming of the railway, when it was still a small fishing town or village.

Tithe maps are brilliant sources for researchers interested in the history of their family or a particular property or place, as each plot on the map is numbered. This is because the maps are accompanied by a list of who owned and occupied each property, as they were used to work out how much tax people should pay based on the value of their property. The system of taxing people according to the value of their property replaced a much more cumbersome medieval system of people rendering a tenth of their agricultural produce to the church.

Railway map, c.1854 (D/DS 177/1)

IMG_2624 1080 watermarked

This 1854 map shows the route the London, Tilbury and Southend Railway was to take through Leigh, cutting through a swathe of existing buildings (D/DS 177/1)

Soon after the tithe map was prepared in 1847, another map of Leigh was produced which shows us the dramatic transformation the old town was about to undergo. This map was prepared in connection with the building of the London, Tilbury and Southend Railway, and shows the somewhat brutal course the track was to take through the town.

Although each building is numbered and presumably linked to a schedule giving names of owners of the properties through which the railway would pass, the whereabouts of the schedule is unknown. The map shows all the familiar Leigh landmarks, including the Bell and Ship inns, the Billet and Smack public houses, the Coast Guard House, the Custom House and individual wharfs and quays.

The building of the railway sliced the old town in two, marooning the High Street on a thin strip of land along the edge of the Thames. Victorian progress was rarely halted by the presence of old buildings that today we would consider precious, and in Leigh the presence of steep cliffs meant there was no alternative but to drive the railway through the town.

Leigh postcard 38 front 1080 watermarked

Leigh-on-Sea High Street in the late nineteenth century, in the part of the old town which was sandwiched between the new railway line (behind the buildings on the left) and the Thames (behind the buildings on the right). The Crooked Billet Inn still survives, as do several of the buildings shown in this picture. (ERO postcard collection, Leigh-on-Sea no. 38)

Ordnance Survey maps

The best maps which show the development of Leigh from 1890 to 1939 are the large scale ordnance survey maps of the “County Series”.

These were made in three waves – the first edition, made in the 1870s, the second edition, from the 1890s, and the New Series, made between the 1920s and 1940s. The county was entirely mapped in two different scales, 6” to the mile and the fabulously detailed 25” to the mile.

IMG_2654 1080 watermarked

Later copy (1964) of the first edition Ordnance Survey map of Leigh which was made in 1873 (MAP/CM/142/1)

Unfortunately we do not have an original 25” to the mile first edition OS map showing Leigh, but we will be bringing a well-known copy of it that was made later. The original map dated from 1873, and we can see that by this time Leigh remained a fairly small place, although now with a railway running through its centre. We can see that adjustments had been made to existing buildings to accommodate the railway, and that a ‘New Road’ had been built alongside it.

Amongst the new buildings shown are the Smack pub in a new building across the street from its original site (which by this time was underneath the railway line) and, on the hill below the church, a new National School which was built in 1852.

IMG_2636 1080 watermarked

Ordnance Survey map of Leigh, 1897

Leigh was resurveyed in 1897 for the second edition of the County Series. By this time, much of the open land around the old town had been divided up to be sold as plots, and new streets had been planned out, with pockets of building underway. This sort of development is seen frequently in our maps of Victorian Essex. Plots were either bought by individuals who then built their own houses, or purchased by developers who built who rows or streets of houses. Some plots were reserved for shops or hotels.

IMG_2644 1080 watermarked

Ordnance Survey map of Leigh, 1922

The next major survey of Leigh took place in 1922, and the map which resulted shows a fairly spectacular explosion of new housing that had been built since the 1890s. The town we see in this map resembles much more closely the town we can see today. Beside the railway, a tramline had been built running along The Broadway from St Clement’s church, past the Grand Hotel, and then along Leigh Road into Southend.


Southend bomb map, 1945 (D/BC 1/4/3/3)

The most recent map which will be on display was made soon after the end of the Second World War, and shows where bombs and other missiles were dropped on Southend, including Leigh, during air raids. If you live in Leigh, was your house near one of these bomb sites?

IMG_2615 edit 1080 watermarked

Map showing where bombs fell on the Southend district during the Second World War, 1945 (D/BC 1/4/3/3)

For more historic maps and images of Leigh, join us at Leigh-on-Sea on the Map on Saturday 18 February 2017, 10.00am-3.00pm, at The Forum, Elmer Square, Southend-on-Sea, SS1 1NE. Entry is free, but if you could make a donation to support our work we would really appreciate it.

Going round in circles

Hopefully when using a map to navigate, you don’t end up going round in circles.

This unusual map, however, goes round in one big circle, showing the area 25 miles around London.

It is currently on display in the ERO Searchroom alongside the oldest map of Essex and these miniature maps of Essex that we have recently written about to celebrate the launch of a new book on the historic maps of our county. Printed Maps of Essex from 1576 is being launched on Saturday 21 May 2016 at Saffron Walden – you can find all the details of the event below.

MAP-CM-67-1 watermarked

The map dates from 1819, and includes a portion of Essex which begins with Sheering in the north-west of the county, before the circular edge sweeps down past the Rodings and Willingale, down to Ingatestone, Billericay and Laindon, before finally passing Vange and Stanford-le-Hope and then reaching the Thames.

The map shows main roads and some secondary roads, parks and most villages. It also defines the extent of the ‘Penny Post’ by a faint dotted line. In Essex the Penny Post line is drawn through Chingford and Woodford, not quite reaching Romford.

MAP-CM-67-1 oblique watermarked

The map was made at a time when the county of Essex was much bigger than it is today, extending as far as the River Lea and including areas such as Stratford, West Ham, Walthamstow and Barking and Dagenham.

If you’re a fan of maps, join us for the launch of Printed Maps of Essex on Saturday 21 May 2016, which will include a talk from the author, map expert Peter Walker, and a display of maps included in the book.

_________________________________________________________________________

Book launch: Printed Maps of Essex from 1576

Human beings have a long history of making maps to visualise and understand the world around them. Our ancient county is represented in many maps from the sixteenth century onwards, both printed and manuscript, a large number of which can be found today at the Essex Record Office. This new well-illustrated volume by map expert Peter Walker, Printed Maps of Essex from 1576, comprehensively lists and evaluates the ERO’s printed map collection and will be an invaluable guide to all those interested in Essex history. Join us to launch the book with a talk from Peter on the maps and the people who made them, and a display of some of the maps themselves. Copies of the book will be available to purchase on the day at a discounted price.

Printed Maps of Essex from 1576 is being published by the Friends of Historic Essex, the charity which supports the Essex Record Office.

Saturday 21 May, 11.00am-2.00pm (talk at 11.30am, display and book sale the rest of the time)

Saffron Walden Town Hall, Market Street, Saffron Walden, CB10 1HZ

Free, no need to book

Miniature maps

When we recently talked about our oldest map of Essex (from 1576) we mentioned how used to we are today to having maps on our phones in our pockets.

Today we are continuing the pocket-sized theme, nineteenth-century style. These miniature maps are amongst those included in a new book, Printed Maps of Essex from 1576, which we are launching on 21 May 2016.

These very small maps were not intended to help people find their way, but rather as illustrations. They are an example of the engraver’s art in making detailed engravings at such a small scale.

These maps are currently part of a small display in the ERO Searchroom, so do have a look next time you visit.

IMG_9844 1080x720

Printed map of Essex by William Green, 1804 (MAP/CM/55/1)

This map is drawn with West to the top of the page, so that it fits well onto the paper. Only after the publication of Ordnance Survey maps from 1805 did it become the convention to put North at the top of the page. It shows only main roads, four parks, towns and a few villages. The map was published in Green’s book The Picture of England Illustrated with correct colour’d Maps of the several Counties, 1804.

MAP-CM-55-1 1080 watermarked

A Map of the County of Essex by George Wise, 1807 (MAP/CM/59/1)

This tiny circular map shows towns and connecting roads, with distances. The Wise family were potters in Kent, and this map was possibly made as an amusement for their clients.

MAP-CM-59-1 watermarked

Printed map of Essex by Robert Miller, 1810 (MAP/CM/60/1)

This map of Essex is Plate 7 from Miller’s New Miniature Atlas of 1810, a small-scale atlas at a low price. It was also used in a children’s atlas, Reuben Ramble’s Travels through the Counties of England.

MAP-CM-60-1 watermarked

Printed map of Essex and Kent by A M Perrot, 1823 (MAP/CM/69/1)

This miniature map includes 10 Essex towns, plus major rivers but no roads. The map itself is almost swamped by the decorative border featuring wheat, foliage, fish, waterfall, cannon, a telescope, and other objects. It is from a French guide to England of 1823.

MAP-CM-69-1 1080 watermarked

_________________________________________________________________________

If you’re a map fan, do join us for the launch of Printed Maps of Essex from 1576 in Saffron Walden on Saturday 21 May 2016 – you can find all the details of the event here.

Essex’s oldest map

Today we are used to being able to carry a map of the world on a smartphone in our pocket, being able to search for anywhere that takes our fancy, to zoom in on it and see not only maps but aerial photographs and streetviews.

This is all very easy to take for granted today, but for our ancestors making a map was an expensive and specialist process. Yet human beings have a long history of making maps to visualise and understand the world around them, and we are lucky to have maps of Essex dating back to the sixteenth century.

A new book, Printed Maps of Essex from 1576, by map expert Peter Walker, brings together all the printed county maps in our collection for the first time. Packed with full-colour illustrations it will be a wonderful companion for any historian of our county. The book is being officially launched at a special event in Saffron Walden on Saturday 21 May 2016; see our events page for details.

Since we like maps so much, we thought we would share a few of our more unusual county maps with you here in the run-up to the book launch, starting with the oldest map of Essex.

Saxton map Essex 1576

This map was made by Christopher Saxton (c.1540-c.1610) in 1576. It would have been printed on a printing press using an engraved copper plate, and then hand-coloured afterwards.

Saxton was the first person to produce an atlas of British counties, in 1579, based on his 7 year survey of the 52 counties of England and Wales. Some counties are combined on sheets, but Essex has its own page. The map was commissioned when fears of a Spanish invasion of England were rife. This may be why the map concentrates on river access to the county, and no roads are shown.

IMG_9847

The map includes illustrations of sailing ships, such as this one off the north coast of the county

The map shows all the towns and villages and a few of the larger mansions with their names; only a small number of parks and bridges are named. Certain estates, such as Hatfield Forest, are shown as enclosed, or impaled, telling us that it was private land, belonging to somebody of significant wealth.

IMG_9849 1080 watermarked

Few other topographical details are marked except rivers, woodland and Shell Haven, the blockhouse on Mersea Island, and the miniature but unnamed drawing of Stanway beacon.

The title is on an elaborate cartouche surmounted by the Royal Arms of Queen Elizabeth I, and below are the quartered arms of Thomas Seckford, Master of the Requests to the Queen, Saxton’s patron.

Cartouch Saxton map

The cartouche gives the map’s title: Essexiae Comitat’ Nova vera ac absoluta descriptio Ano Dni 1576 [A new true and complete description of the County of Essex Anno Domini 1576]

Saxton’s map will be on display in the Searchroom throughout spring 2016, and for more maps come along to the launch of Printed Maps of Essex from 1576 on Saturday 21 May.


What Essex sounds like: soft launch of Essex Sounds audio map

For the past six months, the You Are Hear project team at the Essex Sound and Video Archive has been asking you what Essex sounds like. Whether stopping innocent passers-by in shopping centres, appealing to the public through newspapers, or calling for suggestions through e-bulletins, we have been asking you what noises you hear in your daily routine, what noises you associate with the county, what sounds represent your community.

Now we have the answer! Well, to a point. We have compiled the results with our Sound Recordist, Stuart Bowditch. Based on your suggestions, he has been venturing into the far corners of the county, braving all weathers, to capture those soundscapes. And now you can hear some of the results on our audio map, Essex Sounds.

Horse riding through busy Maldon street, 1 Jan 2016

The hunt parade through Maldon, 1 January 2016. Image courtesy of Stuart Bowditch.

From church bells to firework displays; the annual New Year’s hunt parade through Maldon to the sounding of ship’s horns at Tilbury to bring in the New Year (yes, he managed to capture both, and more besides that day!): see if your suggestion of an Essex sound has been recorded.

In our public surveys about Essex sounds, many people commented on a perceived difference between the north and south of the county. Commonly, people considered the southern part of the county to contain more industrial noises, more hustle and bustle, more crowded atmospheres: with more people speaking with a London or ‘TOWIE accent’. The north was depicted as quieter, more rural, where the people are more likely to speak with a ‘traditional’ Essex accent.

A cow wading in a stream in Dedham Vale

Peaceful Dedham Vale in north Essex. Image courtesy of Visit Essex.

Is this an accurate depiction of the county, or is it over-generalised? Why not consult the Essex Sounds map to see if it reflects this north-south divide?

The map also enables comparisons between old and new sounds of the county. We have uploaded some historic recordings from the Archive. For example, you can listen to an auction at the Chelmsford cattle market in the 1950s.
[soundcloud url=”https://api.soundcloud.com/tracks/228652756″ params=”auto_play=false&hide_related=false&show_comments=true&show_user=true&show_reposts=false&visual=true” width=”100%” height=”450″ iframe=”true” /]
You can then compare it with a recording made on that site in 2015, capturing the busy atmosphere of High Chelmer on a Saturday. Try it out here.

If your sound suggestion has not yet been added, do not fear: our site is still a work in progress. Stuart will continue to record Essex sounds over the next few months, gradually uploading them to the audio map. We will also keep adding historic recordings as they are digitised, as part of this Heritage Lottery Funded project. We are also happy to continue to receive suggestions of places and events to record, though we will not be able to include everything within the scope of the project.

In the meantime, why not contribute your own recording to the site? We want the map to fully reflect your experiences of what Essex sounds like. You will find instructions on the ‘contribute’ page, but please get in touch if you have any questions.

We would love to hear any feedback you have, so that we can continue to improve the site and pass on your comments to our website developers, Community Sites. Please be gentle with us, though: we are still in the development phase! We would also be grateful for any volunteers to test the map more extensively, particularly if you are using accessibility software. Please get in touch to find out more.

For more information about the You Are Hear project, you can visit the project site.

HLF Logo

In search of Messing Hall: an adventure in old maps

We are in the midst of preparing for our next ‘on the map’ outreach event, which will take place in the village of Messing near Tiptree on Saturday 19 March 2016. We have done a few of these events in different locations around the county, taking a timeline of maps from our collection out for a special pop-up display.

One of the maps we will be taking with us on this occasion is this 1650 map showing the lands of Messing Hall (D/DH P1).

Map of Messing, 1650

‘A survey of all the lands appertaineing to Messing Hall in the county of Essex with the number of acres the wch was surveyed by William Bacon and Benedict Coule’ (D/DH P1)

Messing Hall itself is shown to the east of the village centre as a very grand moated building, with a farm to the north.

The map is part of a collection of papers relating to the Luckyn family of Messing. Sir Capel Luckyn acquired the estate of Messing Hall in 1650, so presumably he commissioned the map as he took possession of his grand new property.

The map makes an immediate visual impact, but on closer inspection bears only a passing resemblance to the actual layout of Messing – cue ERO staff members scratching their heads and poring over maps, aerial photos and any histories of Messing we could get our hands on, trying to work out what the 1650 map actually showed us.

Trying to work it all out

Trying to work it all out

Ordnance Survey map of Messing, 1874

The 6″ : 1 mile Ordnance Survey map of 1874

To begin with it all seemed a confusing mess. While the 1650 map shows the grand Messing Hall on a road heading east out of the village, the Ordnance Survey map of 1874 shows that there is no such road, leaving us with a mystery to solve – where was Messing Hall? The representation of it on the map no doubt blows the size of the house out of all proportion, but clearly an important property existed and we could find no obvious sign of it on any later maps.

There were two main candidates for the site – Harborough Hall, to the south of the village, and Messing Lodge, to the north.

Our sights first landed on Harborough Hall – it was the closest substantial property to the village, and sits on a bend in the road, as does the property on the 1650 map. We read that the manors of Messing and Harboroughs merged in the 1400s, so perhaps the names had been used interchangeably.

Messing Lodge, meanwhile, just seemed too far from the village and too far north. Could the 1650 map really be that inaccurate?

We hunted for anything that would help us tie up the things represented on the 1650 map with more accurate later maps.

Our first breakthrough came from matching up Oynes Brook, shown on the 1650 map, with Domsey Brook shown on later maps. Once we had found the brook, we were able to match up the forked road shown in the 1650 map to the north of Messing Hall with the fork shown in later maps above Messing Lodge. Although not quite the same shape, on both maps one fork crosses the brook (and stops short just after it), and the other fork becomes ‘Easthop way’ or ‘Easthorpe Road’. There are also water features on the 1897 map which could relate to the moat shown in 1650.

Portion of the 1650 map showing Messing Hall compared with 1897 map showing Messing Lodge

Portion of the 1650 map showing Messing Hall compared with 1897 map showing Messing Lodge

This was pleasing evidence, and was further supported by some of the field names surrounding the property.

Fields named 'Charcums' near Messing Hall

Fields named ‘Charcums’ near Messing Hall

The 1650 map shows ‘Great Charcums’, ‘Charcum meadow’ and ‘Charcums spring’ to on the opposite side of the road to Messing Hall. On the tithe map of 1839, fields near to Messing Lodge are known as ‘Little Chalkhams’ and ‘Great Chalkhams’.

With the evidence of the brook, the fork in the road, the road to Easthorpe and the Charcum/Chalkhams field names, we think we have a satisfactory answer to our mystery, and we can put Messing Hall back on the map.

One of the joys of research is problem solving, and the excitement when things finally fall into place, especially when you can share that joy with fellow researchers.

Fortunately for the 1650 map, what lacks in accuracy it makes up for in exuberance. Come along to see it for yourself at Messing about with Maps on Saturday 19 March at Messing Village Hall.


Messing about with Maps

A chance to see historic maps of Messing kept at the Essex Record Office in Chelmsford, including a hand-drawn map from 1650 and the Messing tithe map of 1839.

Saturday 19 March, 10.30am-3.00pm

Messing Village Hall, The Street, Messing, CO5 9TN

Just drop in, suggested donation of £2.00